Automatic and optimistic memory scheduling for ML workloads in Ray
Since the release of Ray 2.0, with our goals to make distributed computing scalable, unified, open, and observable, we have continued this course with subsequent Ray releases. Guided by these goals to increase observability and ability to prevent memory-intensive Ray Tasks and Actors resources that affect cluster-wide resource degradation, this blog introduces an out of memory (OOM) monitor and detection feature — all part of our efforts to make Ray easy to observe and debug for machine learning engineers. Currently in beta, this monitor is available in Ray release 2.2 and 2.3, and will continue to enhance it in future releases.
LinkWhy do you need OOM monitoring?
An out of memory error is a common fatal occurrence in Python libraries. There are a number of motivational reasons why you need an OOM memory monitor. First, some common Python libraries and frameworks, including ones that support distributed compute, do not provide a policy-based monitor that can preempt a memory-hungry Python application, especially during processing of large amounts of unstructured data. When a node runs out of memory, the offending process or the node on which it runs could crash. On linux, a rudimentary prevention is performed by the out of memory manager. Worst case, without any intervention, OOMs could degrade the cluster or fail the application.
One common example in machine learning (ML) workloads is to preprocess huge amounts of data, in order of tens of gigabytes. A user defined function (UDF) preprocessing this volume per core could result in an OOM if the batch size is too big to fit into the heap space. Another example is a slow Ray actor or task with a gradual memory leak during distributed training will eventually make the node inaccessible.
Second, while Python is the favorite, preferable, and easy-to-use programming language for data scientists and ML practitioners, out of the box, Python offers little built-in support to control policy-based memory usage and detection mechanism to forestall or foresee a possible runaway Python memory-hungry application.
Third, none of the common distributed compute frameworks such as Apache Spark provide a policy-based scheduling mechanism to prevent OOM events. This is a crucial feature out of the box to handle ML workloads for a diverse set of use cases.
And finally, in a Ray’s cluster environment where scaling your ML workflow and workloads are essential, it’s likely that a long running Ray task or an actor, either unwittingly because of a programming flaw you introduced or because of processing large amounts of unstructured data while using a third-party Python library, will consume large amounts of memory off the heap. This could result in an OOM error and disturb your application.
Worse, this avarice of memory consumption could stall fetching metrics, disrupt the Ray Dashboard display, and terminate Ray’s controlling processes, making the cluster unusable.
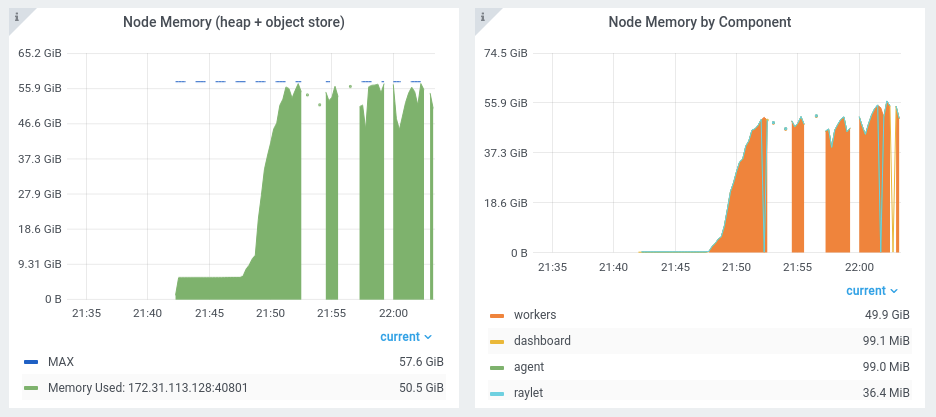 Figure 1a: Metric shows disruption before the use of the OOM monitor
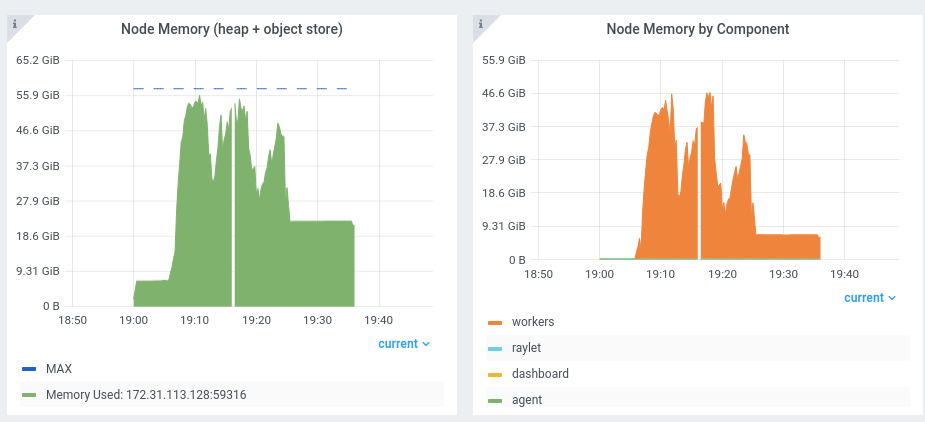 Figure 1b: Shows smooth operation and no disruption with the OOM monitor
To ensure better Python support in detection of memory usage mechanisms while using Ray native libraries or third-party Python libraries with Ray, we were motivated to offer an OOM monitor as a novel feature that achieve three things:
Observe and detect possible bad actors or tasks to mitigate worse cases scenarios
Offer to act with policy-based preventive and preemptive measures based on default configurations
Enable many embarrassingly parallel ML and python compute workloads to “just work” with automatic and policy-based memory detection and prevention, without adjusting any memory specific dials or manual intervention, which the common distributed compute frameworks such as Apache Spark lack.
What are those preventive or preemptive measures and how does an OOM monitor work?
LinkHow does the OOM monitor work?
Embedded within the Raylet process on each Ray cluster node, the monitor periodically inspects collective memory usage–heap space and object store–for each worker on the cluster node, fetching it from the underlying operating system, as depicted in Figure 2.
At any point during these inspections, if the collective usage exceeds a configurable threshold (see below for those thresholds), the Raylet process will terminate a task or an actor as a preventive or preemptive measure before an OOM event occurs, and reshedule it later.
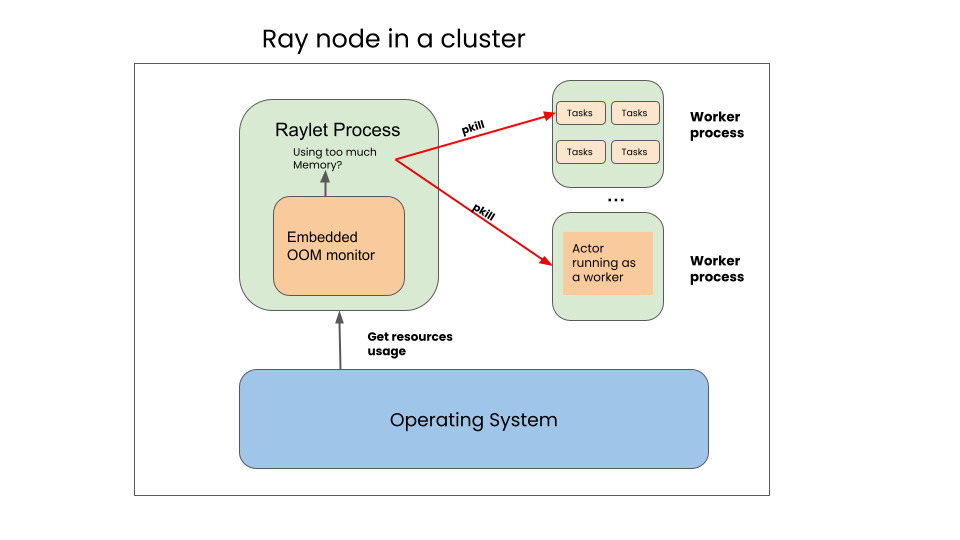 Figure 2: OOM monitor high-level architecture and data flow
By default, the monitor is enabled, and you can further fine tune it, based on your use case and memory demands, with a minimum set of configurable environmental variables described in the documentation. If the application requires additional memory, you can increase the threshold as described in the docs. And to disable the monitor, follow the instructions in the documentation.
LinkPolicy for terminating memory-intensive tasks
When the memory usage exceeds the threshold, the raylet will apply a policy to decide which task to free up for memory. The raylet will apply the policy as needed to bring down the usage below the threshold. The policy is a multi-step process to filter down to the worker that should be killed:
It first filters for tasks that are retriable.
It groups the tasks by the caller that submitted it, and picks one of the groups.
Within that group, it picks one task to kill.
The policy first prioritizes tasks that are retriable, i.e., when max_retries or max_restarts is > 0. This is done to minimize workload failure. Actors by default are not retriable since max_restarts defaults to 0. Therefore, by default, tasks are preferred to actors when it comes to what gets killed first.
When there are multiple callers that have submitted tasks, the policy will pick a task from the caller with the most number of running tasks. If two callers have the same number of tasks it picks the caller whose earliest task has a later start time. This is done to ensure fairness and allow each caller to make progress. A caller could be the driver process or another task or actor.
Among the tasks that share the same caller, the latest started task will be killed first.
Below is a program to demonstrate the policy in action. In this example, we create two tasks, which in turn creates four more tasks each:
1import ray
2
3@ray.remote
4def task_submitted_by_driver():
5  futures = [leaf_task.remote() for _in range(4)]
6  ray.get(futures)
7
8@ray.remote
9def leaf_task():
10  print("running leaf task")
11  pass
12
13tasks = [task)submitted_by_driver.remote() for _ in range(2)]
14ray.get(tasks)Below is the task execution graph, where the tasks are colored such that each color forms a group of tasks where they belong to the same task submitter:
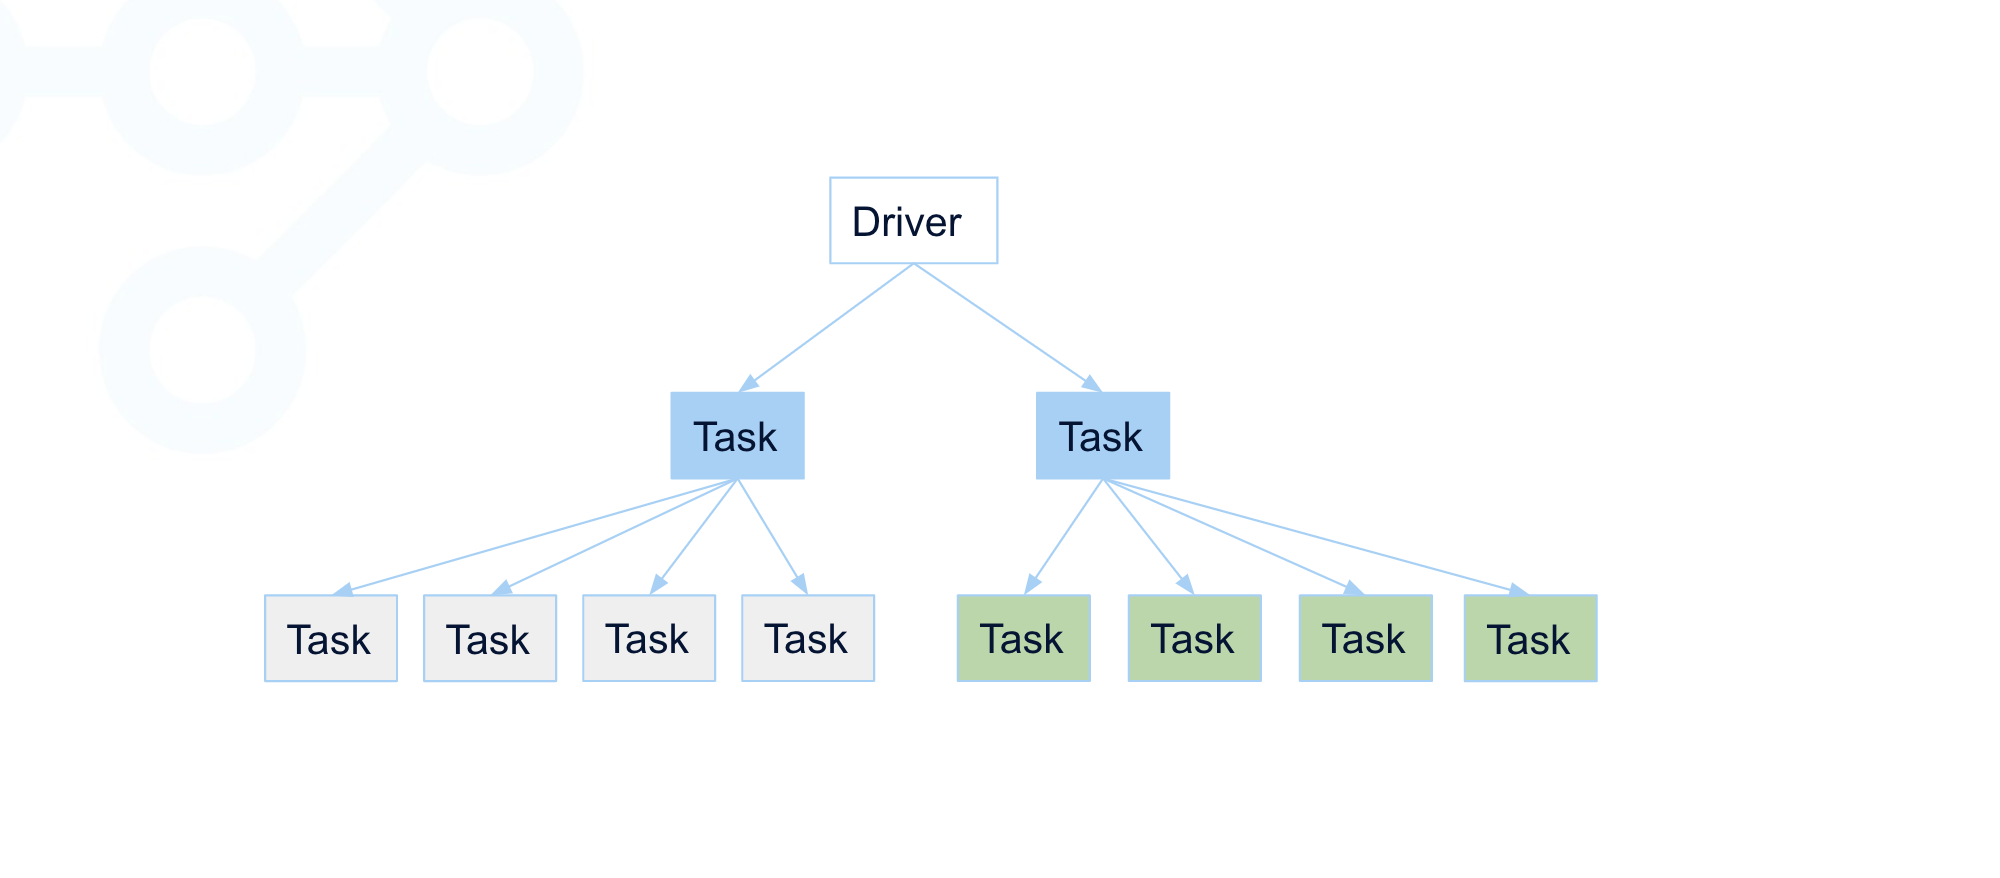 Figure 3: Grouping of candidate tasks for applying the policy
In this example, the tasks are divided into 3 groups:
The first group of two tasks are submitted by the driver.
The second group that contains four tasks are submitted by the blue task on the left.
The third group that contains four tasks are submitted by the blue task on the right.
Note the driver, which runs the main program, is not retriable and does not belong to any group.
If, at this point, the memory monitor sees the node memory usage is above the threshold, it will pick a task from the submitter with the most number of tasks, and kill its task which started the last. In the example, we assume the second group’s tasks were started later than the third group’s.
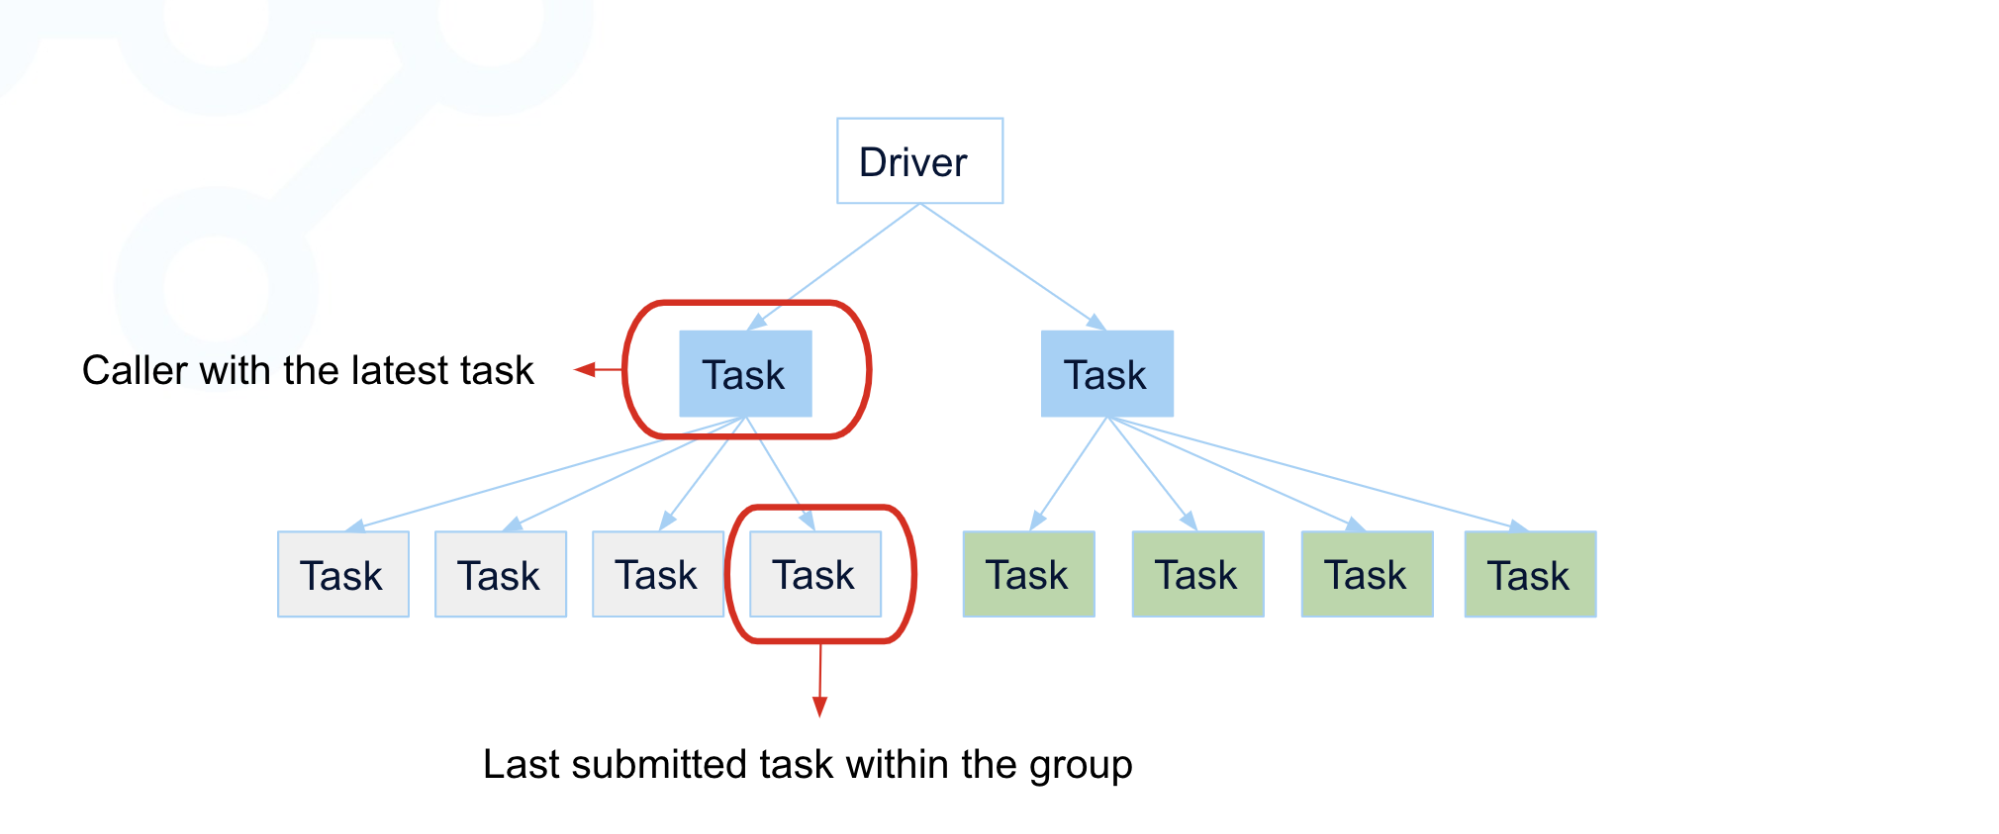 Figure 4: Applying the policy - the second group’s last task is terminated
After the termination of the last task, if, at this point, the memory monitor sees again the node memory usage is still above the threshold, it will repeat the process, and pick a task from the submitter with the most number of tasks:
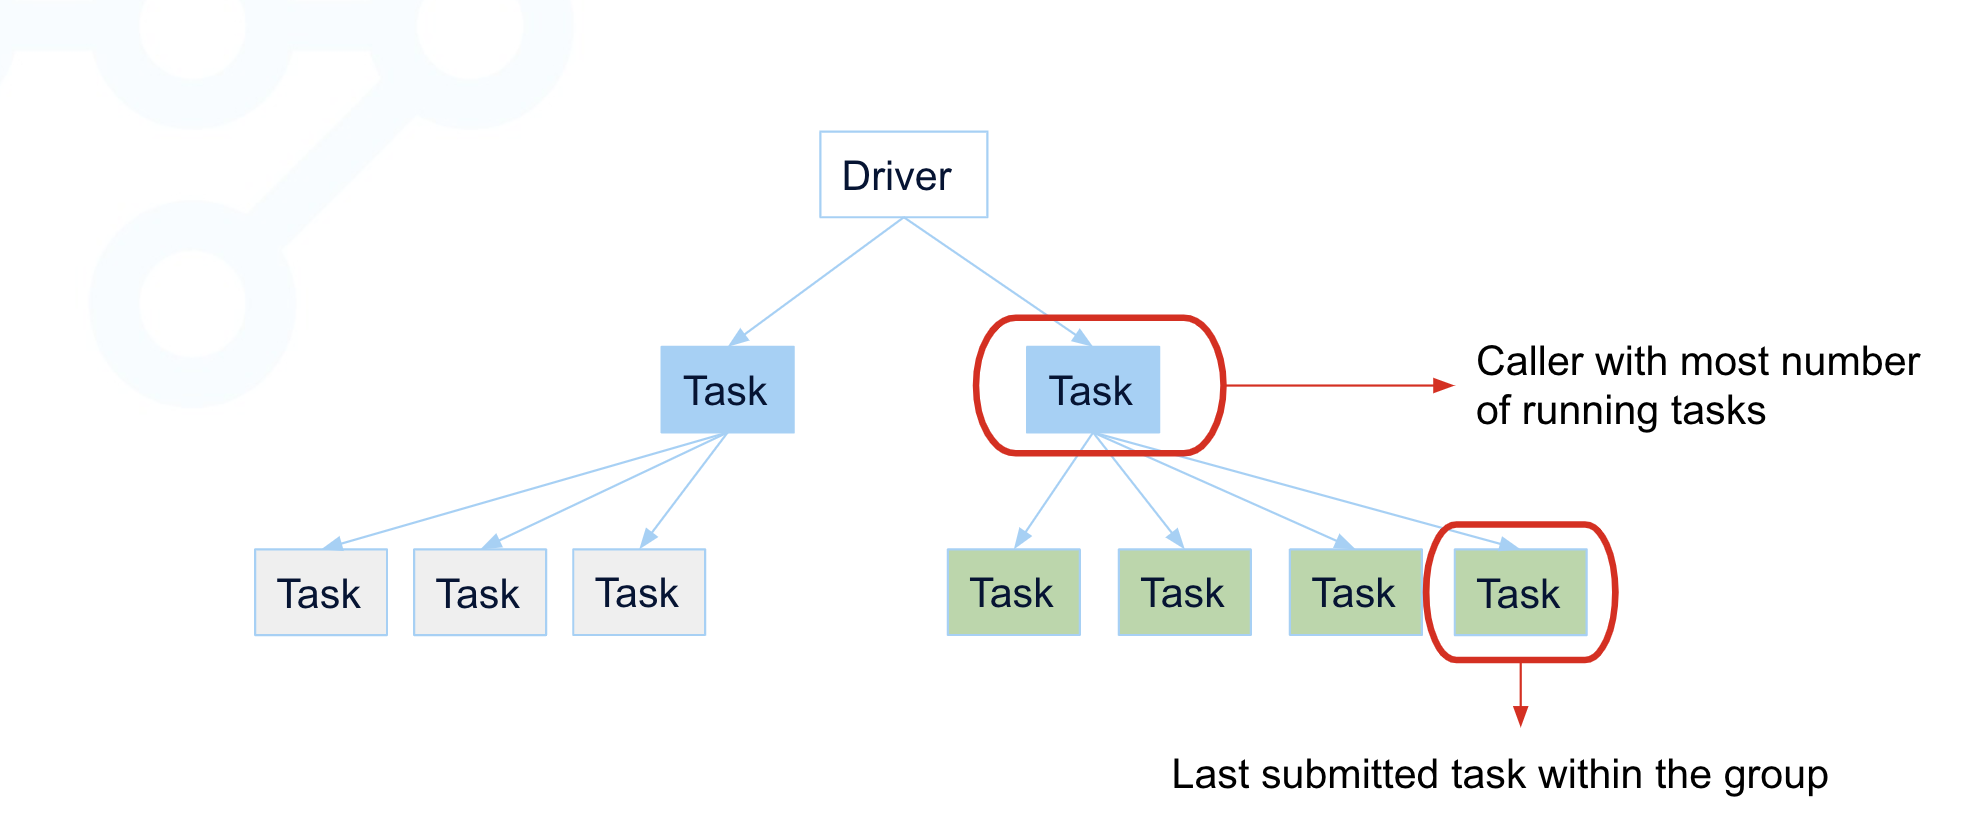 Figure 5: Applying the policy the second time, when the memory usage is still above the threshold
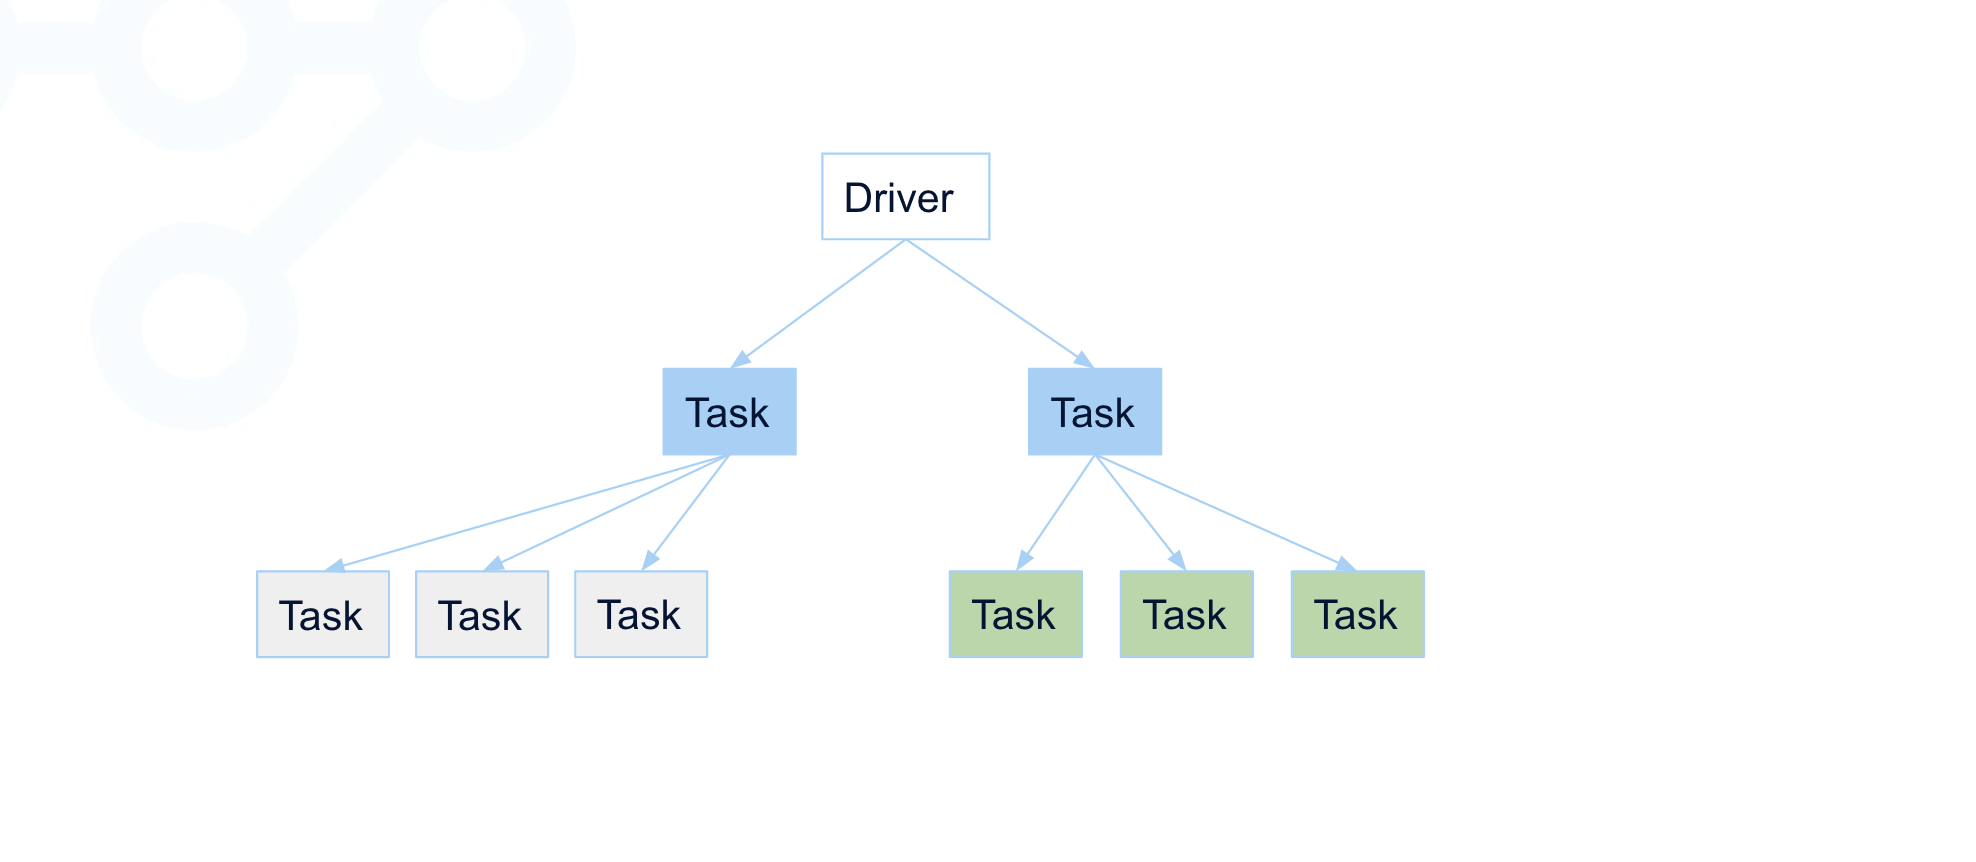 Figure 6: The third group’s last task is terminated by the policy
The memory monitor avoids infinite loops of task retries by ensuring at least one task is able to run for each submitter on each node. If it is unable to ensure this, the workload will fail with an OutOfMemory error. Note that this is only an issue for tasks, since the memory monitor will not indefinitely retry actors.
Below is a program where the memory-leaking task will fail immediately, since it is the last and only task submitted by the driver:
1import ray
2
3@ray_remote(max_tries=-1):
4def leaks_memory():
5  chunks=[]
6  bits_to_allocate = 8 * 100 * 1024 * 1024    #100 MiB
7  while True:
8    chuncks.append([0] * bits_to_allocate)
9
10try:
11  ray.get(leaks_memory.remote()
12except ray.exceptions.OutOfMemoryError as ex:
13  print("This task will throw an OutOfMemory error without retyring")
If the workload fails due to OutOfMemoryError, refer to the Ray documentation on how to address the issue.
LinkHow to investigate OOM problems with the monitor and Ray Dashboard
Imagine we have a program that runs two tasks in parallel and leaks memory constantly:
1import ray
2
3@ray.remote(max_retries=-1)
4def leaks_memory():
5    chunks = []
6    bits_to_allocate = 8 * 100 * 1024 * 1024  # ~100 MiB
7    while True:
8        chunks.append([0] * bits_to_allocate)
9
10ray.get([leaks_memory.remote() for _ in range(2)]
With the Ray memory monitor turned on (which is the default since Ray 2.2), the driver will print the following message when the raylet has killed the workers due to the memory usage going above the threshold:
11 Workers (tasks / actors) killed due to memory pressure (OOM),
20 Workers crashed due to other reasons at node
3(ID: 2c82620270df6b9dd7ae2791ef51ee4b5a9d5df9f795986c10dd219c, IP:
4172.31.183.172) over the last time period. To see more information about
5the Workers killed on this node,
6
7use `ray logs raylet.out -ip 172.31.183.172`
8
9Refer to the documentation on how to address the out of memory issue:
10https://docs.ray.io/en/latest/ray-core/scheduling/ray-oom-prevention.html.
11
12Consider provisioning more memory on this node or reducing task parallelism
13by requesting more CPUs per task. To adjust the kill threshold, set the
14environment variable `RAY_memory_usage_threshold` when starting Ray.
15To disable worker killing, set the environment variable `RAY_memory_monitor_refresh_ms` to zero.
16
17task failed with OutOfMemoryError, which is expected
18
This shows the raylet has killed 1 worker in the past 1 min (the default reporting interval). We can get details of the node’s memory usage from the raylet logs at the time the worker was killed. One way to quickly fetch the raylet logs is to issue ‘ray logs’ from the command line on the head node, by copy-pasting the command provided in the message above.
ray logs raylet.out -ip 172.31.183.172
If we browse the logs we will see the details of the memory usage at the time the worker was killed:
1Top 10 memory users:
2PID     MEM(GB) COMMAND
32161    15.18   ray::leaks_memory
42211    11.90   ray::leaks_memory
51550    0.11    /home/ray/.vscode-hosted-server/vscode-reh-web-linux-x64/node --max-old-space-size=3072 /mnt/cluster...
6339     0.11    /home/ray/anaconda3/bin/python /home/ray/anaconda3/lib/python3.7/site-packages/ray/dashboard/dashboa...
71366    0.09    /home/ray/.vscode-hosted-server/vscode-reh-web-linux-x64/node /home/ray/.vscode-hosted-server/vscode...
856      0.09    /home/ray/anaconda3/bin/python /home/ray/anaconda3/bin/anyscale session web_terminal_server --deploy...
91583    0.08    python blog.py
1051      0.07    /home/ray/anaconda3/bin/python -m anyscale.snapshot_util autosnapshot
11246     0.06    /home/ray/anaconda3/lib/python3.7/site-packages/ray/core/src/ray/gcs/gcs_server --log_dir=/tmp/ray/s...
121449    0.06    /home/ray/anaconda3/bin/python /efs/workspaces/expwrk_lsnsr1z7bflh4xlga32le7lj91/cluster_storage/vsc...
13
Here we can see the two tasks consuming the majority of the memory on the node. Given the amount of memory consumed, it is likely due to a memory leak from the tasks.
To double check, we can go to the Ray dashboard, and look at the node memory usage under the metrics tab:
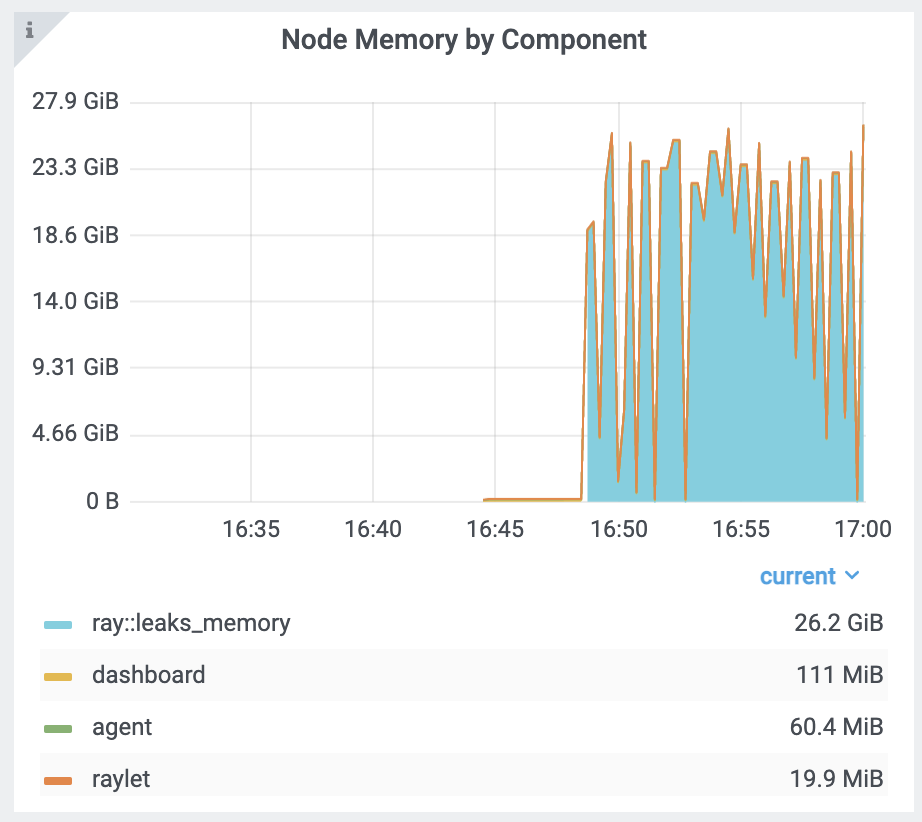 Figure 7: Memory usage spikes by tasks at it grows fast
Note sometimes the memory usage may grow too fast due to the number of tasks running in parallel. When that happens, the memory monitor may not be able to keep up with the memory growth, and the OS OOM killer will kick in as a fall back, when some process fails to allocate memory.
The OS OOM killer will kill a process that has high memory usage via SIGKILL. Ray also sets the oom score for the workers to reduce the likelihood that the OS will kill critical ray processes like the raylet. When this happens, tasks or actors will fail without a clear error message, and the driver will print an error message that looks like the following:
1The actor is dead because its worker process has died. Worker exit type:
2UNEXPECTED_SYSTEM_EXIT Worker exit detail: Worker unexpectedly exits with a
3connection error code 2. End of file. There are some potential root causes.
4
5(1) The process is killed by SIGKILL by OOM killer due to high memory usage.
6(2) ray stop --force is called. (3) The worker is crashed unexpectedly due
7to SIGSEGV or other unexpected errors.
8
To verify if this is caused by OOM, check the Ray dashboard to see if the node memory usage is close to the limit. Furthermore, depending on the OS, check the kernel logs to see if the OS OOM killer triggered and killed the worker. To find the logs on Ubuntu use the following command (may require sudo):
dmesg -T
Browsing the logs we can see the OS OOM killer has killed the task:
1oom-kill:constraint=CONSTRAINT_MEMCG,nodemask=(null),cpuset=431955d77fd24ac80cfdae518bcb1902c00eda5d733b5b8d8cfe364789ebb843,mems_allowed=0,oom_memcg=/docker/4
231955d77fd24ac80cfdae518bcb1902c00eda5d733b5b8d8cfe364789ebb843,task_memcg=/docker/431955d77fd24ac80cfdae518bcb1902c00eda5d733b5b8d8cfe364789ebb843,task=ray::leaks_memo,pid=117644,uid=10
300
4
5Memory cgroup out of memory: Killed process 117644 (ray::leaks_memo) total-vm:44400568kB, anon-rss:28903420kB, file-rss:32412kB, shmem-rss:0kB, UID:1000 pgtabl
6es:57140kB oom_score_adj:1000
7
8oom_reaper: reaped process 117644 (ray::leaks_memo), now anon-rss:0kB, file-rss:0kB, shmem-rss:0kB
9
10ray::leaks_memo invoked oom-killer: gfp_mask=0xcc0(GFP_KERNEL), order=0, oom_score_adj=1000
11LinkConclusion
To sum up, OOM errors are pernicious and can degrade cluster usage if not detected and mitigated in a timely manner. We described why you need an OOM monitor and what were the primary motivations for it:
Common Python libraries and frameworks do not provide a policy-based monitor to preempt runaway-hungry memory code.
Out of the box, Python offers little support for easy detection and mitigation of memory-hungry applications. Nor do other distributed compute systems offer this policy-based detection and prevention novel feature.
For Ray to scale ML workloads, it’s imperative that it can continue to run your ML application without distributing the Ray cluster while ensuring, monitoring, and preempting any memory leaks as part of your workload by preempting those tasks without disrupting the entire ML workload because of an OOM error.
To achieve all this, the OOM monitor applies grouping policies in a hierarchical grouping to ascertain and detect the most likely candidate for preempting. This policy applies fairness to ensure arbitration of which candidate is selected based on a multi-step process that filters down to the selected worker for termination.
Enabled by default in Ray 2.2 and 2.3, you can further visually examine the OOM monitor’s effects and actions in the Ray Dashboard via the Metrics tab. Furthermore, all the OOM actions are logged for further perusal.
As a memory metric lens into your Ray application and an ability to prevent and preempt any OOM errors are huge benefits for Ray observability and transparency of your ML workloads.
LinkWhat’s next?
For any new open source feature, having a community have a go at it and provide feedback, either via slack or filing issues, is important for iterating and improving. So try it out and let us know should you run into issues.
Also, we gave a talk on the OOM memory monitor at our Ray Meetup. If you missed our previous Ray talk on observability and debugging Ray, you can view the meetup talk here. Join our Ray slack for suggestions or questions on the #observability channel.
Finally, if you are a Ray user and would like to share your Ray journey or use cases with the Ray global community, our call for presentations to the Ray Summit 2023 are open until March 6.


