Ray Task Monitoring at Scale: Announcing Persistence for +10k Tasks on Anyscale
Today we’re excited to announce the persistent Ray Task Dashboard on Anyscale, which enables scalable monitoring and debugging of Ray workloads with visibility that persists beyond cluster shutdown. The fully managed dashboard on Anyscale leverages the new Ray Event Export framework that is available starting with Ray 2.49.
Tasks, functions executed remotely and in parallel, are the foundation of distributed computation in Ray. Without clear observability into tasks, diagnosing bottlenecks, debugging failures, or tuning performance quickly becomes guesswork that slows iteration and drives up costs.
The existing Ray Dashboard task view has been a popular tool for developers, but it comes with two critical limitations:
10k task limit. Task data is stored in Ray’s Global Control Service (GCS) in memory. To avoid overloading the system, only the most recent 10k tasks are shown, which is far below what large data and AI workloads demand. GCS constraints also limit event reporting frequency, meaning some observability data may be dropped.
Not persistent. The dashboard is served from the head node and disappears once the node is terminated. Keeping the head node alive after jobs finish is the only workaround today, but this is not cost-effective.
With task persistence on Anyscale, built on Ray's Event Export framework, developers now have a scalable, cost-efficient way to capture and analyze task events via managed dashboards.
See the documentation for instructions on enabling the dashboard.
LinkAnyscale Task Dashboard
LinkFeature Overview
The Anyscale task dashboard is particularly useful for Ray Core users, so let's take the example of a Core workload where tasks do some amount of work, configured by their inputs. The dashboard updates in near real-time, allowing users to monitor job progress as it runs or analyze results after the job completes.
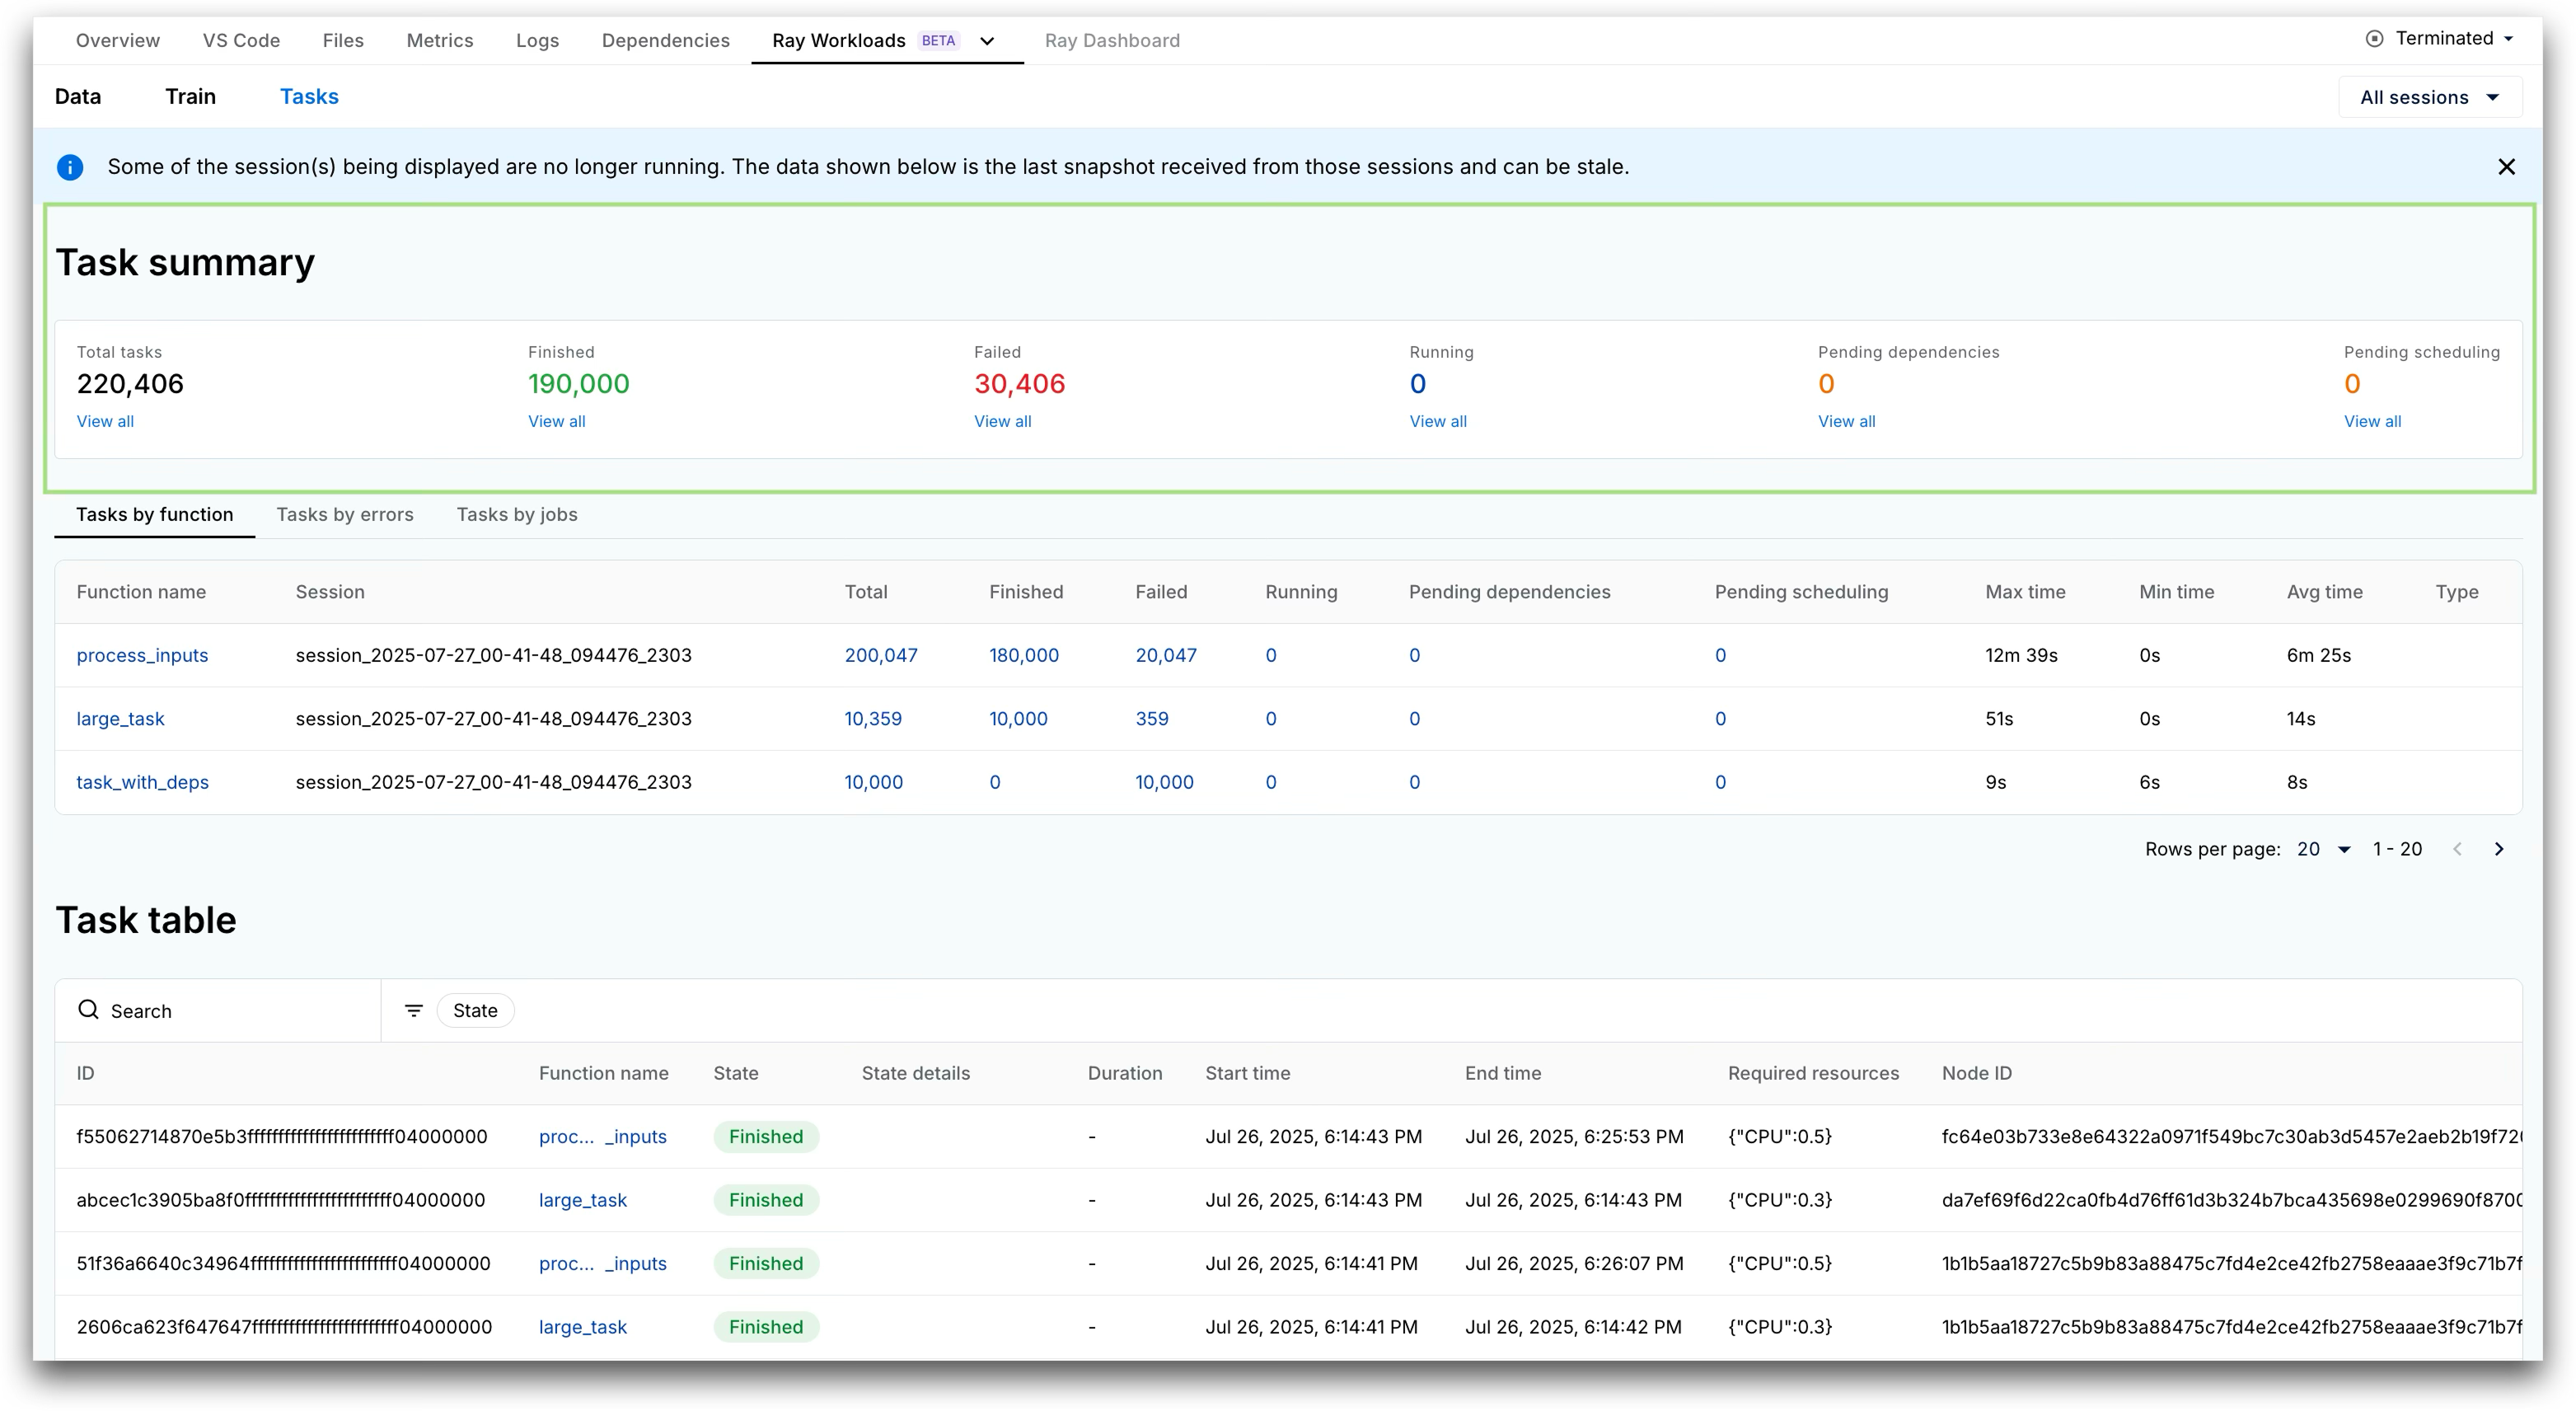
High Level Overview: The first section of the dashboard gives users a quick overview of how their job is progressing. The summary panel at the top gives a high level summary of task counts by state (e.g. finished, failed, running etc).
 Figure 1: Task summary view in Anyscale Dashboard
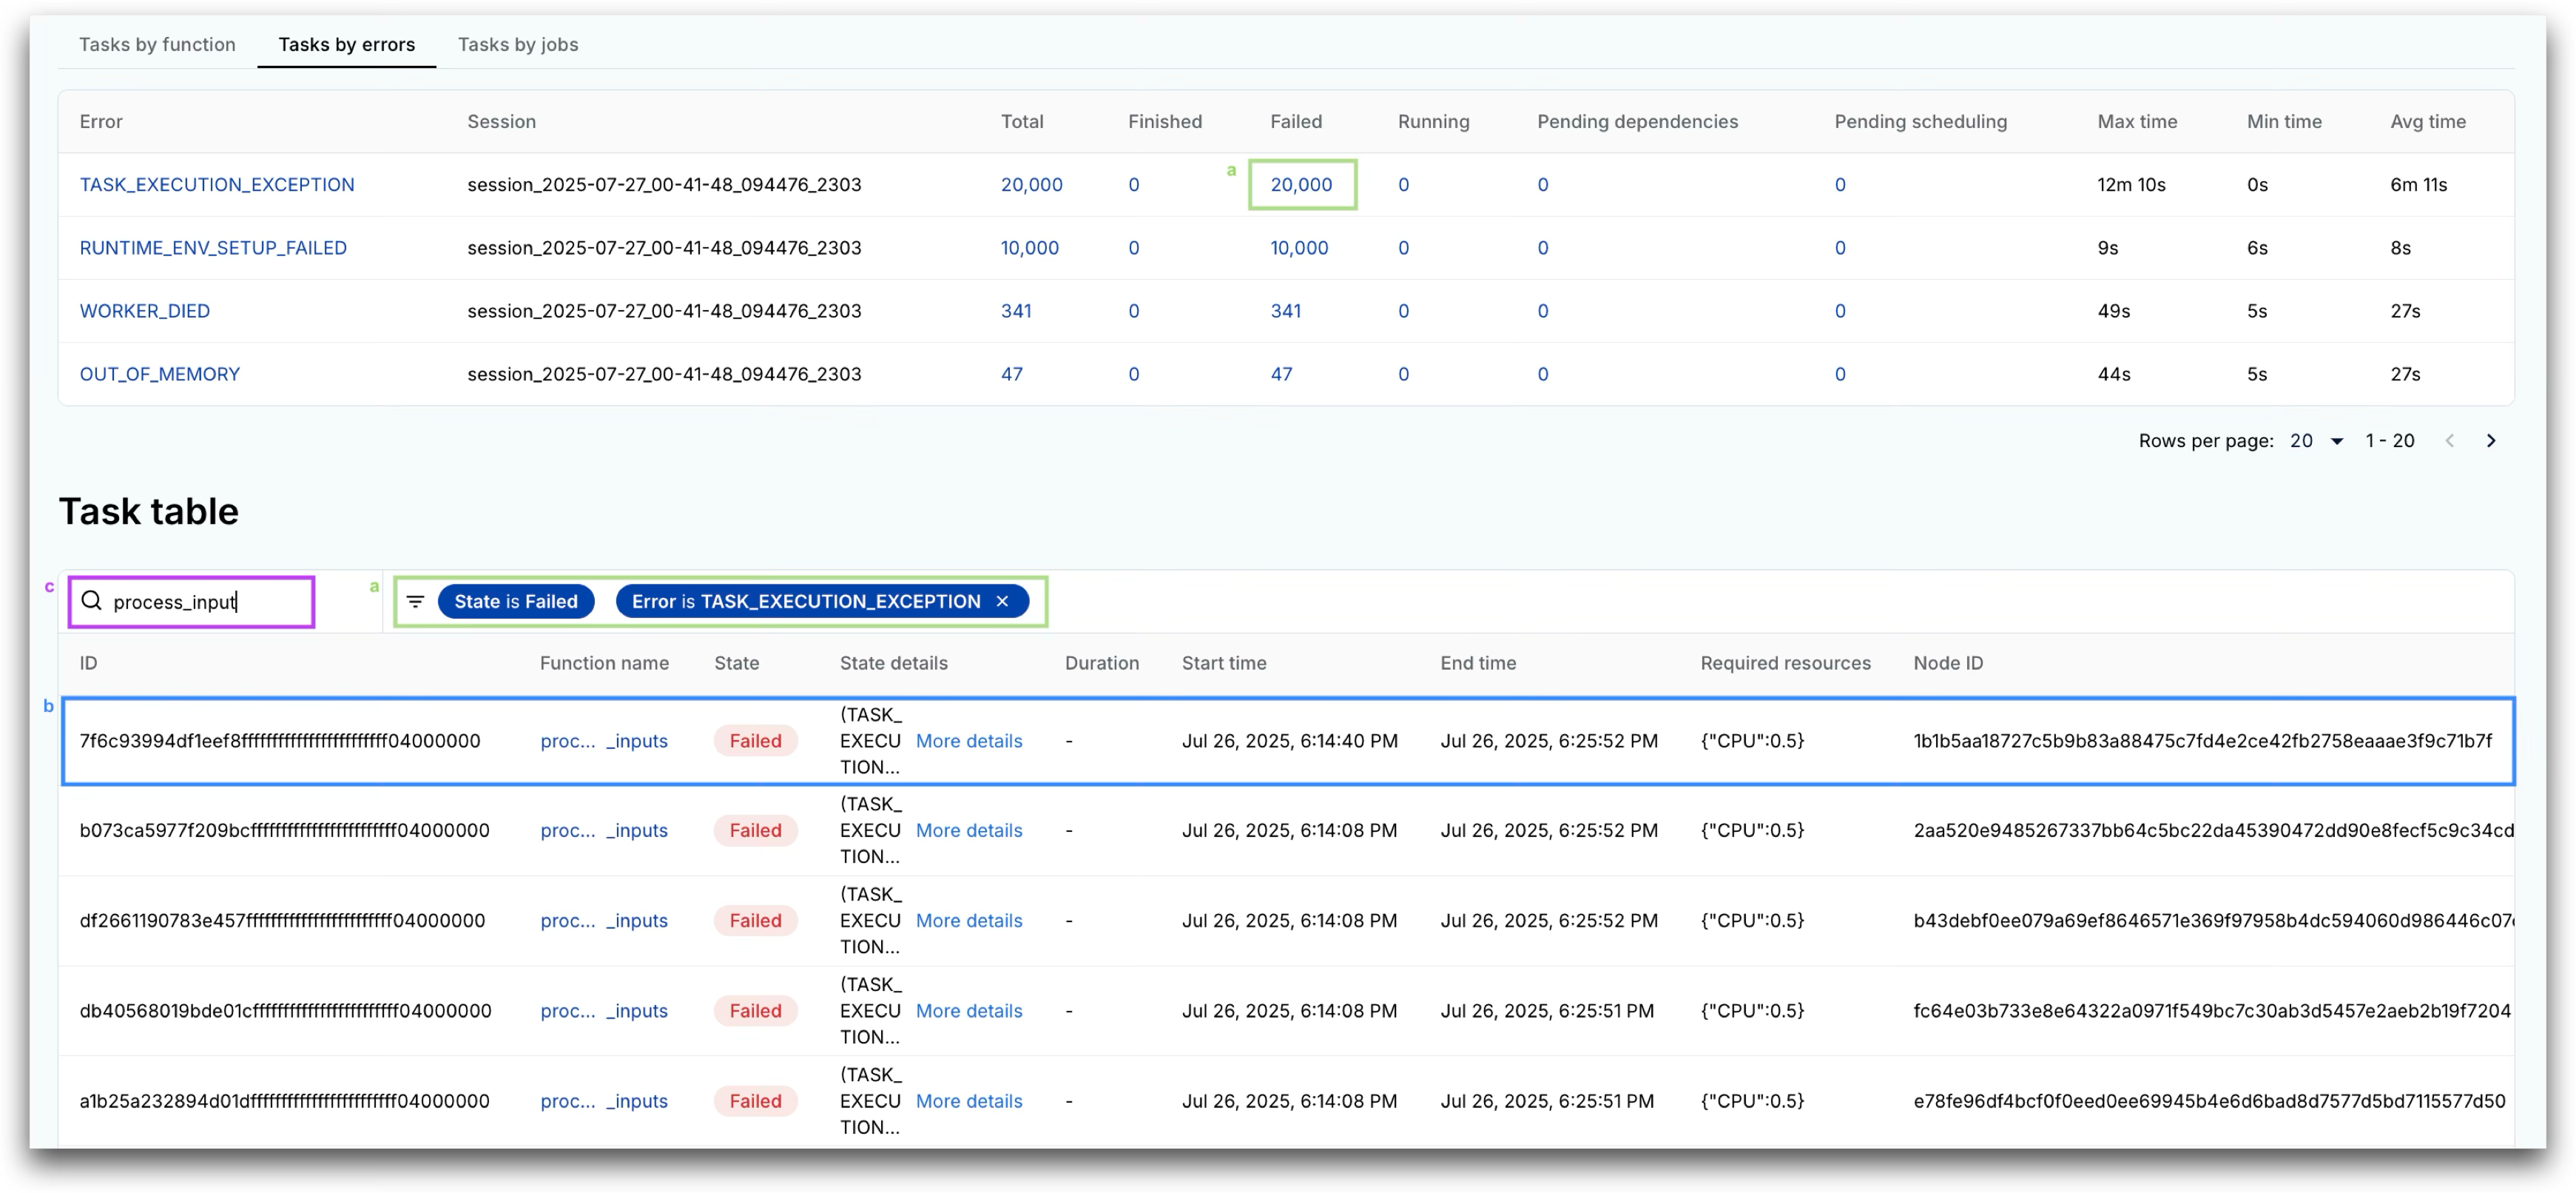
Aggregated views: Following that are a number of aggregate view panels that group tasks by function name, error type, and Ray job ID. Alongside task state counts, these panels include duration distributions to help identify outliers.
 Figure 2: Task aggregated views in Anyscale Dashboard
Individual Task Analysis: The task table at the bottom of the dashboard provides detailed information on individual tasks for further analysis.
 Figure 3: Detailed task table view in Anyscale Dashboard
All of the aggregate views above include clickable counts that filter the task table accordingly.
Each row includes full task metadata, such as node and worker IDs, which can also be used to filter metrics in the Grafana dashboards.
Stack traces, function names, and various IDs can be queried directly through the search bar.
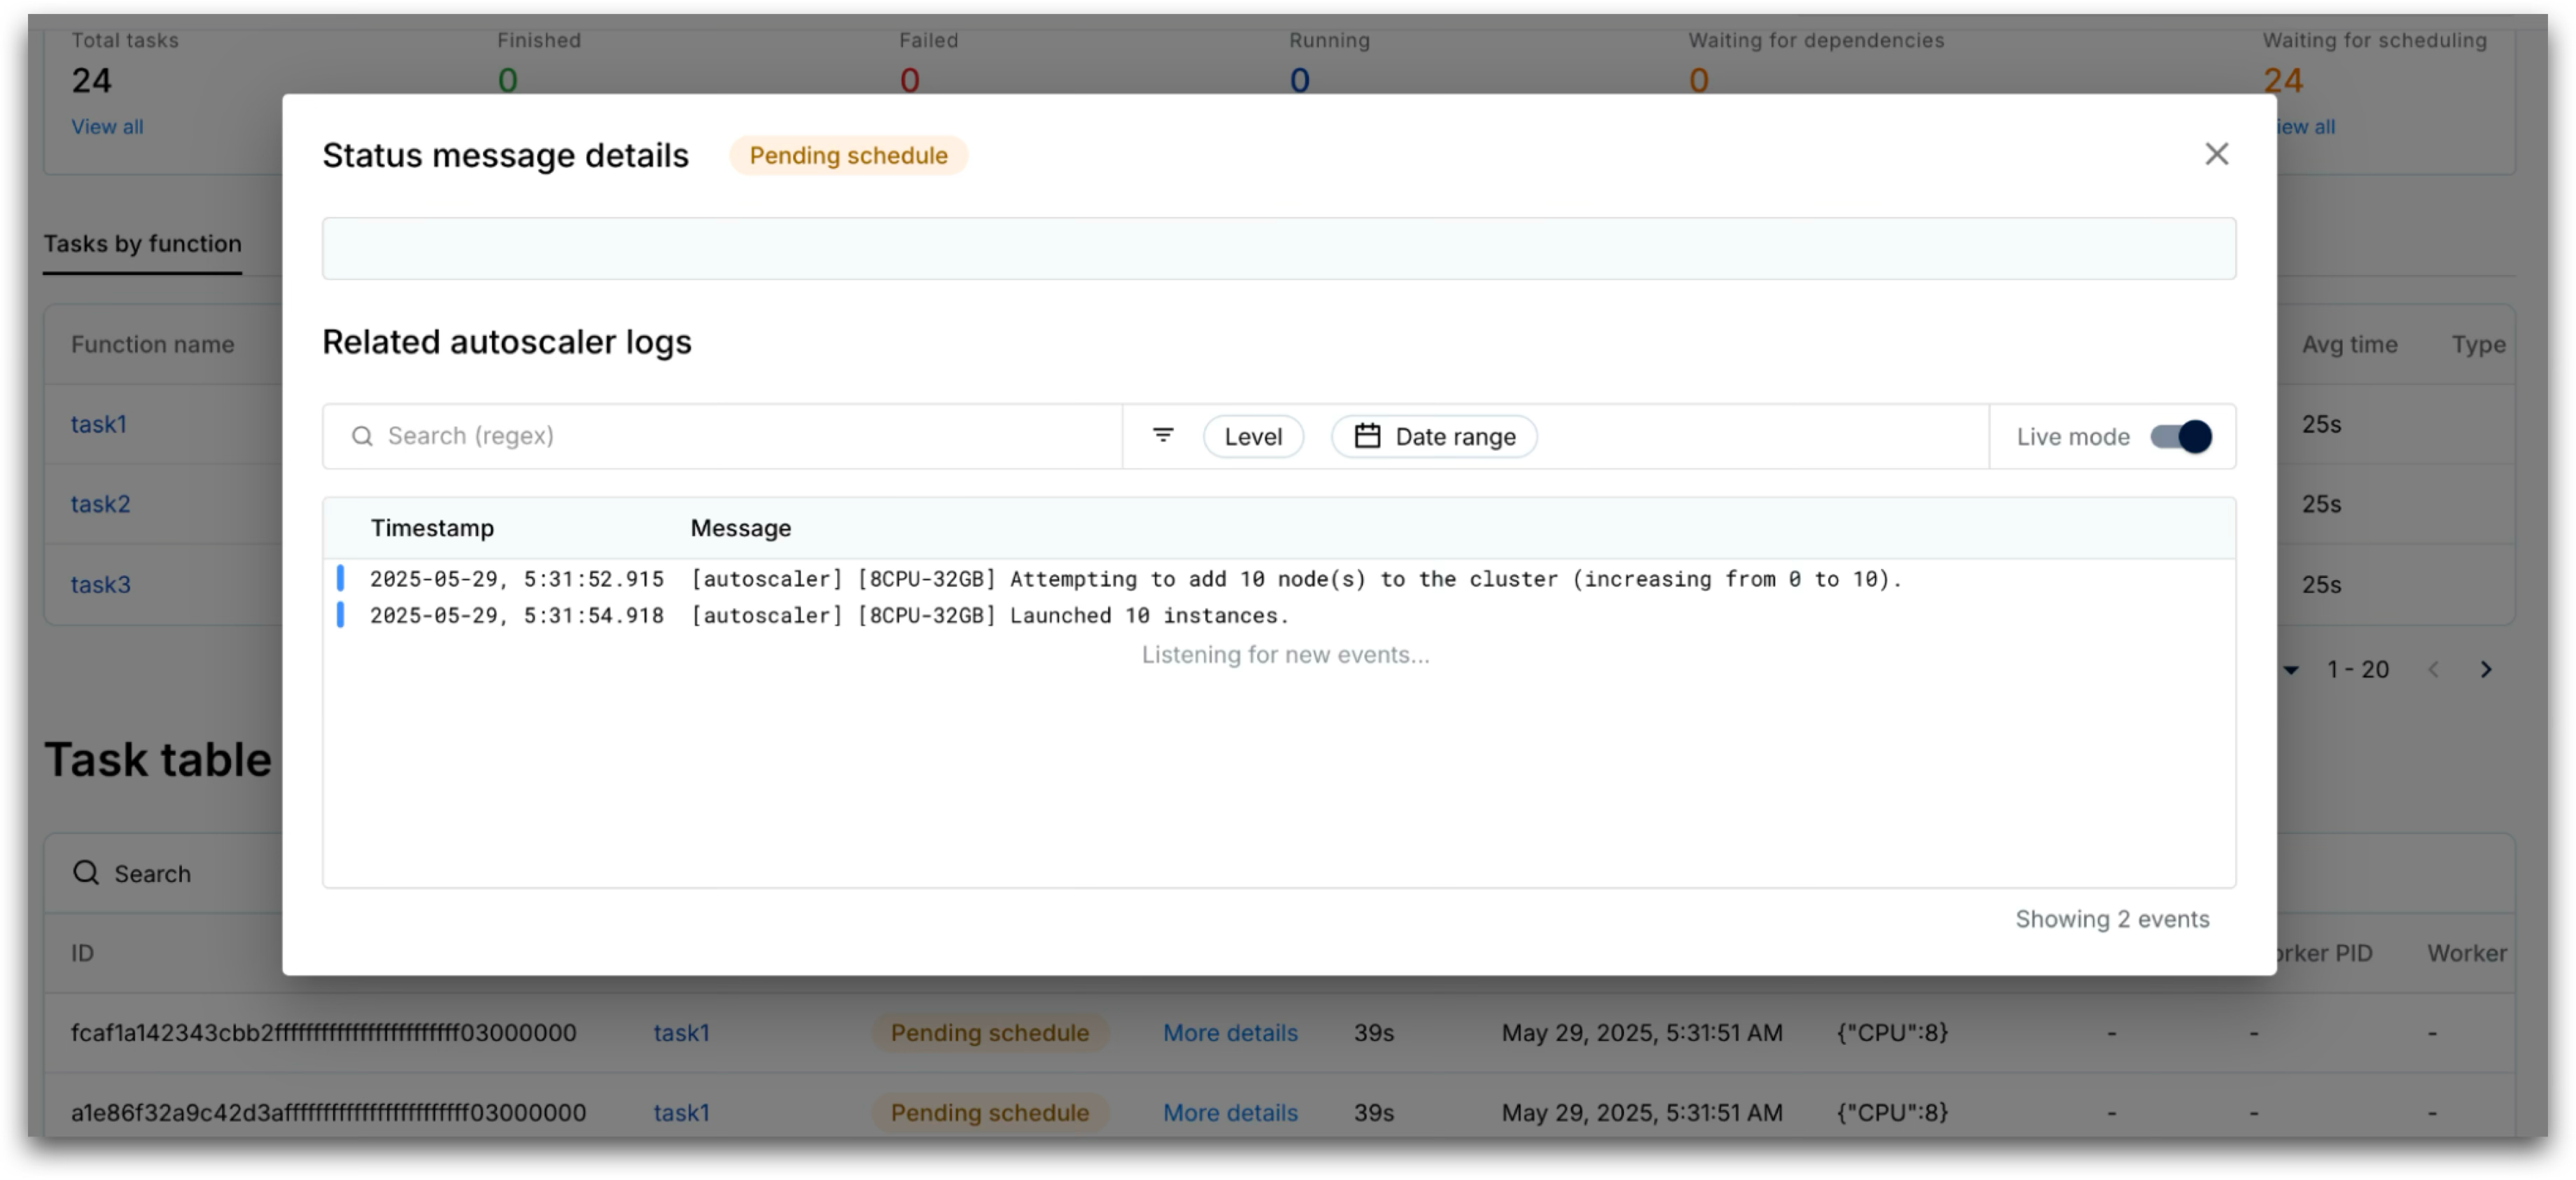
Contextualized Information: Because this dashboard is built into the Anyscale managed platform, we can contextualize Ray workload data with additional relevant information from the Anyscale infrastructure. For example, when a task is stuck in the Pending schedule state, the dashboard can surface related Anyscale Cloud autoscaler logs to help diagnose potential scheduling delays.
 Figure 4: Anyscale Cloud autoscaler logs view to provide contextualized information about task state
LinkArchitecture
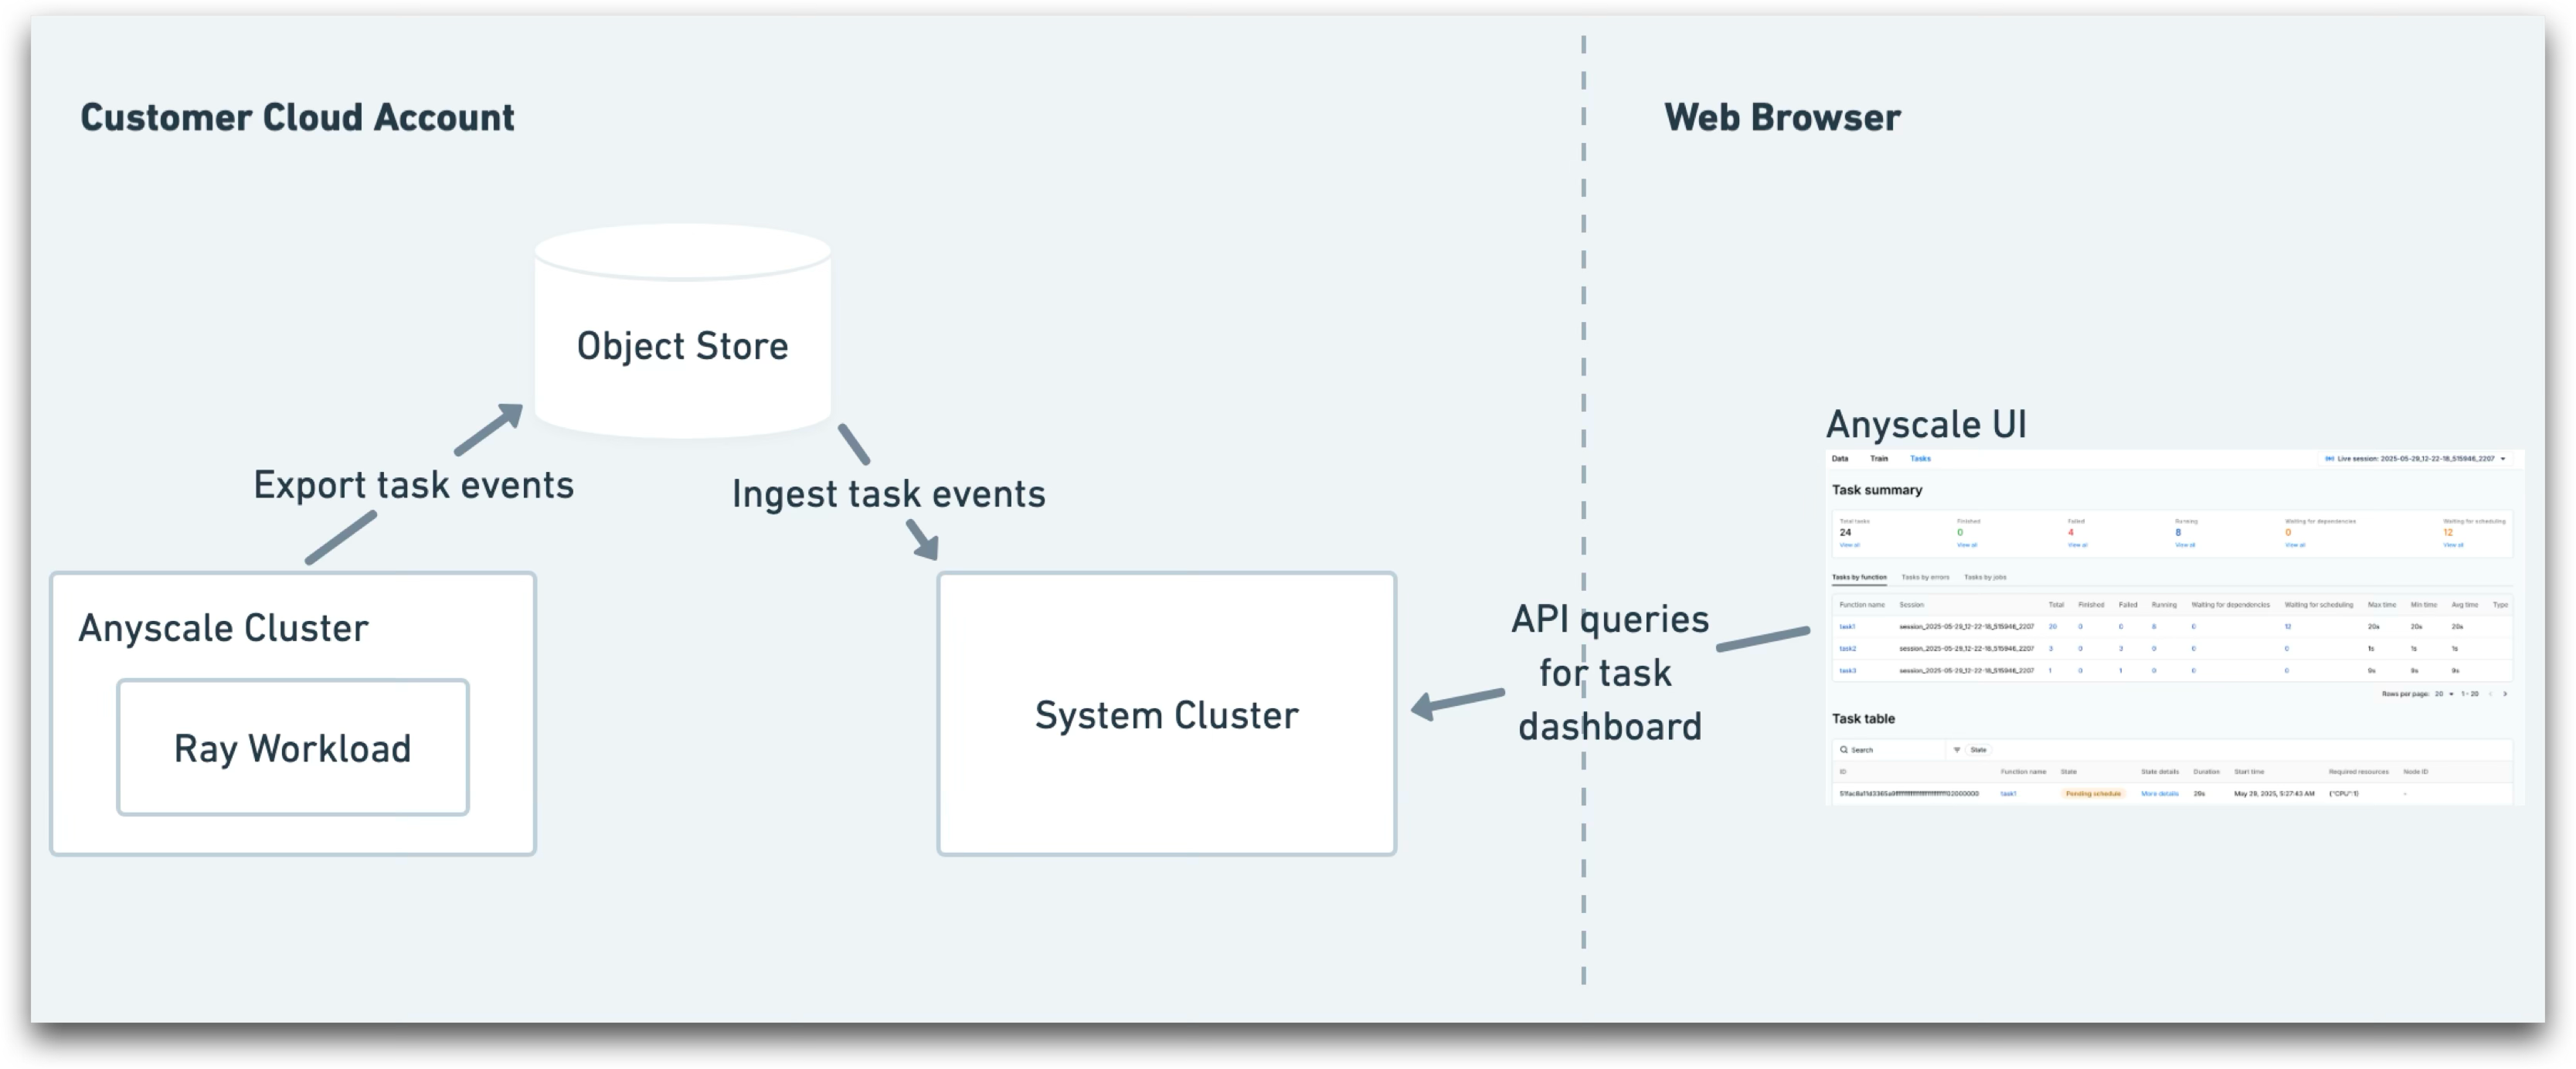
When building a persisted dashboard on the Anyscale managed platform, maintaining data privacy is a key design consideration. To be truly useful, the dashboard must include detailed information such as stack traces and function names, which may contain sensitive user data. To balance the requirement of keeping customer data within their own cloud account while still delivering a responsive and scalable user experience, we built a dedicated system cluster to power the Anyscale task dashboard.
 Figure 5: Architecture of Anyscale task dashboard that keeps customer data in their own cloud account
The system cluster is a single ephemeral instance per Anyscale cloud that runs in the customer’s account and remains active while the task dashboard UI is being viewed. This approach provides several key benefits:
Scalable backend: The system cluster allows us to choose the best tools to ensure the task dashboard backend scales effectively with user workloads. As a result, we’ve tested the dashboard to handle millions of tasks smoothly.
Data privacy maintained: Customer data powering the task dashboard is neither stored nor streamed through the Anyscale control plane because the UI directly queries from the customer cloud.
Cost efficiency: Additional costs remain minimal due to an auto-terminate policy that automatically shuts down the system cluster when the task dashboard is idle.
LinkRay Event Export Framework
Where does the data for the task dashboard come from?
Ray has always emitted metrics and logs that users could collect and persist using external systems. While useful, these data sources aren't sufficient to support all the detailed views shown in the task dashboard. Logs often lack structured information, which makes them hard to transform and query. On the other hand, metrics are better suited for aggregate insights, but adding high-cardinality labels, like task IDs, can impact query performance. Because of these limitations, Ray’s metrics don’t offer the level of granularity needed for individual task level visibility in the dashboard.
To solve this, we’re introducing Event Export, a new open source system which emits structured events that describe progress of the Ray workload. Currently it supports task events, and we plan to expand coverage to Ray entities in the near future.
To avoid overloading GCS with task event traffic, we updated Ray’s event emission architecture, building on the existing task event framework. Rather than having each core worker send task events directly to GCS, we introduced a per-node aggregator agent. This agent collects events from all core workers on its node and forwards them to user-specified HTTP endpoints. In the case of Anyscale, these events are pushed to a receiver that writes them to the object store, which enables the task dashboard.
 Figure 6: Architecture of Ray's Event Export which introduces an aggregator agent per node
Open source users can also take advantage of the Event Export framework by setting up consumers to stream this data to any destination they choose. Each task event emitted includes all the metadata and state transitions required to recreate the task view shown in the dashboard, so any Ray user can build a custom, persistent dashboard tailored to their needs.
The Event Export framework is available in Ray 2.49 and later. For setup instructions and examples, check out the official documentation.
LinkFuture Plans
The Event Export framework and the system cluster architecture serve as a foundation to build a fully persisted Ray dashboard on the Anyscale platform, which will enhance how users monitor, debug, and optimize Ray workloads. Eventually this data can also enable automated issue detection and workload optimization.
We are actively working on adding events from other Ray Core resources and library components to the Event Export framework, and plan to roll out additional persisted dashboards on Anyscale. The Ray Train and Data dashboards were also recently released (see blog post), and we’re planning to enhance them with links to persisted, detailed task data for each Ray Data operator or Train worker.
LinkTry it Today
Experience a more scalable, cost-efficient and fully persisted task dashboard out of the box on the Anyscale platform.
Share Anyscale feedback by submitting a ticket through the Anyscale Console
Share feedback or help contribute to the Ray Event Export project
Join us Ray Summit 2025
See real-world examples and see Ray and Anyscale product announcements on 2-day, community-led conference that brings together the best engineers and researchers working on top of open source technologies to advance AI.
San Francisco | Nov 3-5, 2025. Learn More.


